What you need to know about monitoring containers
 May 17th, 2017
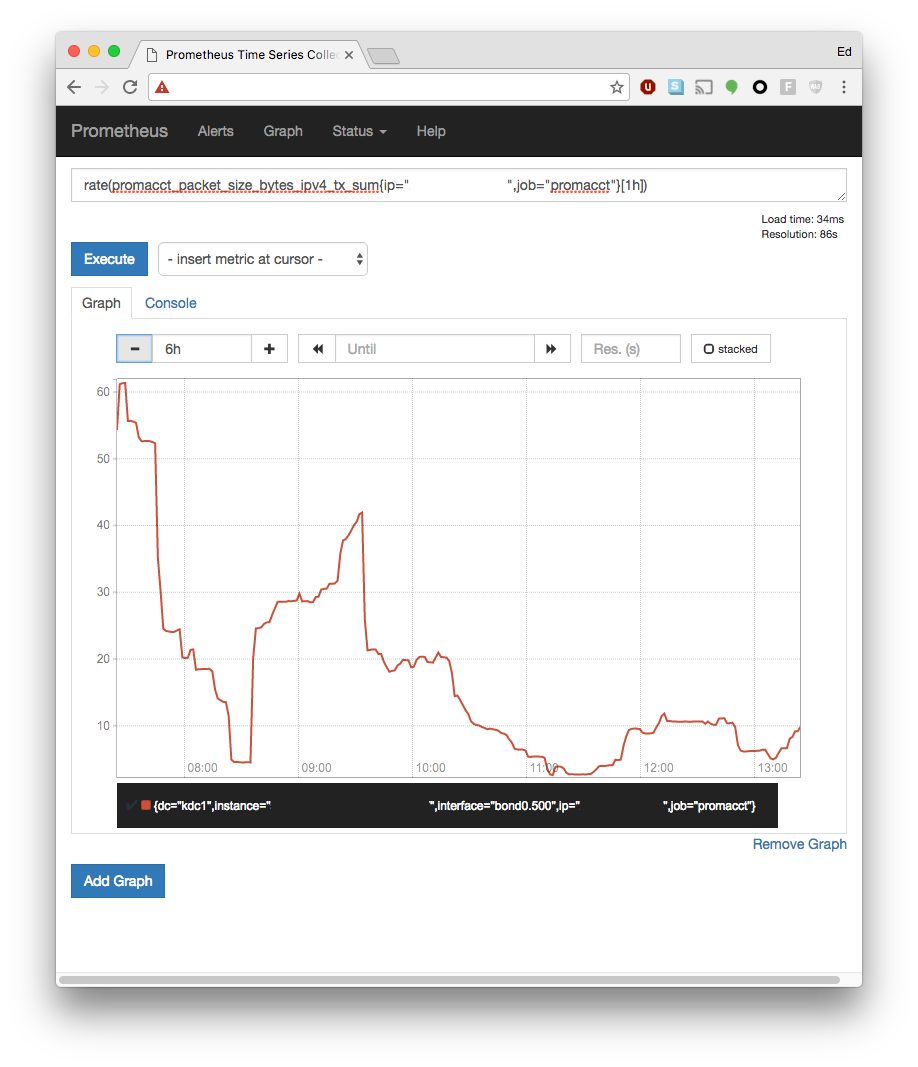
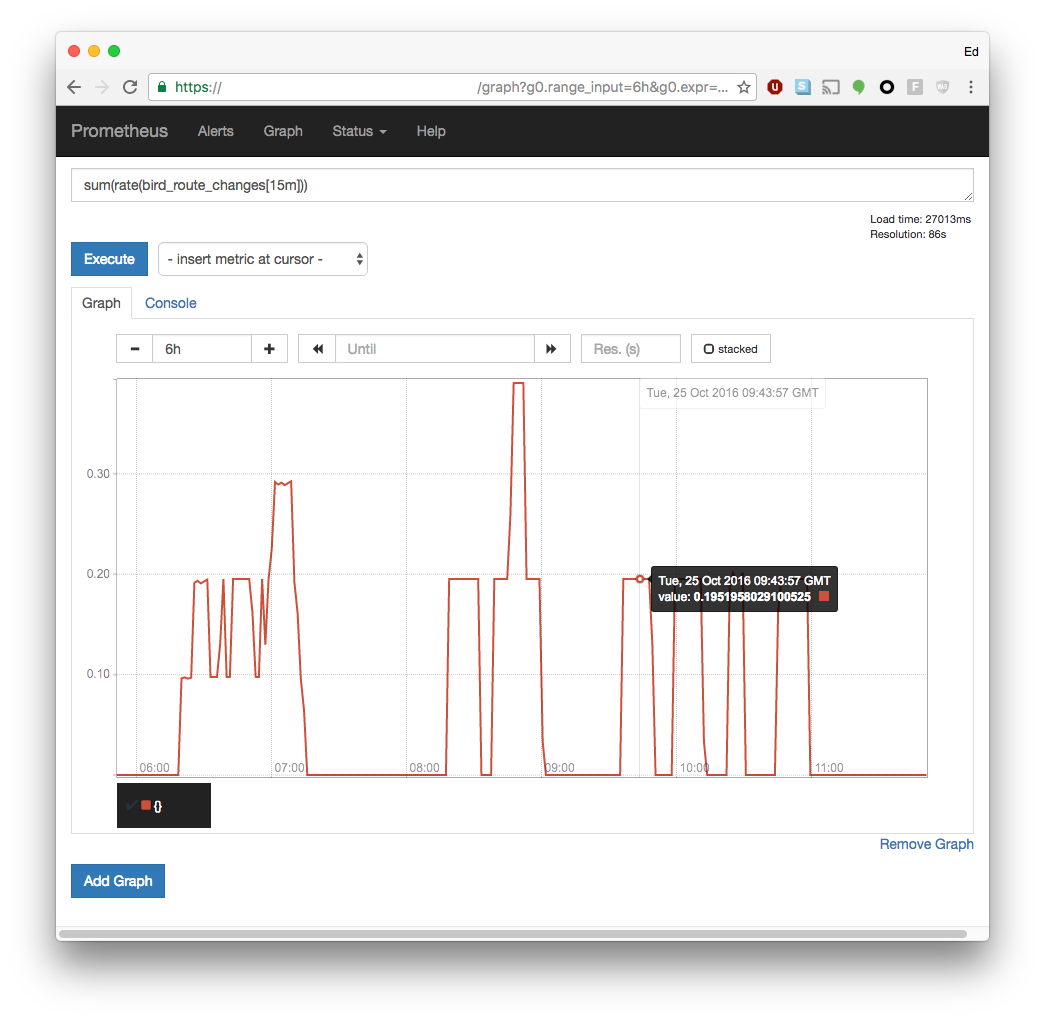
When adopting a new technology, you will always face some challenges. When it comes to container technology, one of the important questions in this regard is how to get insight in the behaviour of your applications and container environment. Which features are essential when it comes to your monitoring system? Which metrics should processes expose? And what about blackbox and whitebox monitoring? In this article, our Prometheus expert Ed Schouten talks about the monitoring of containers.
More...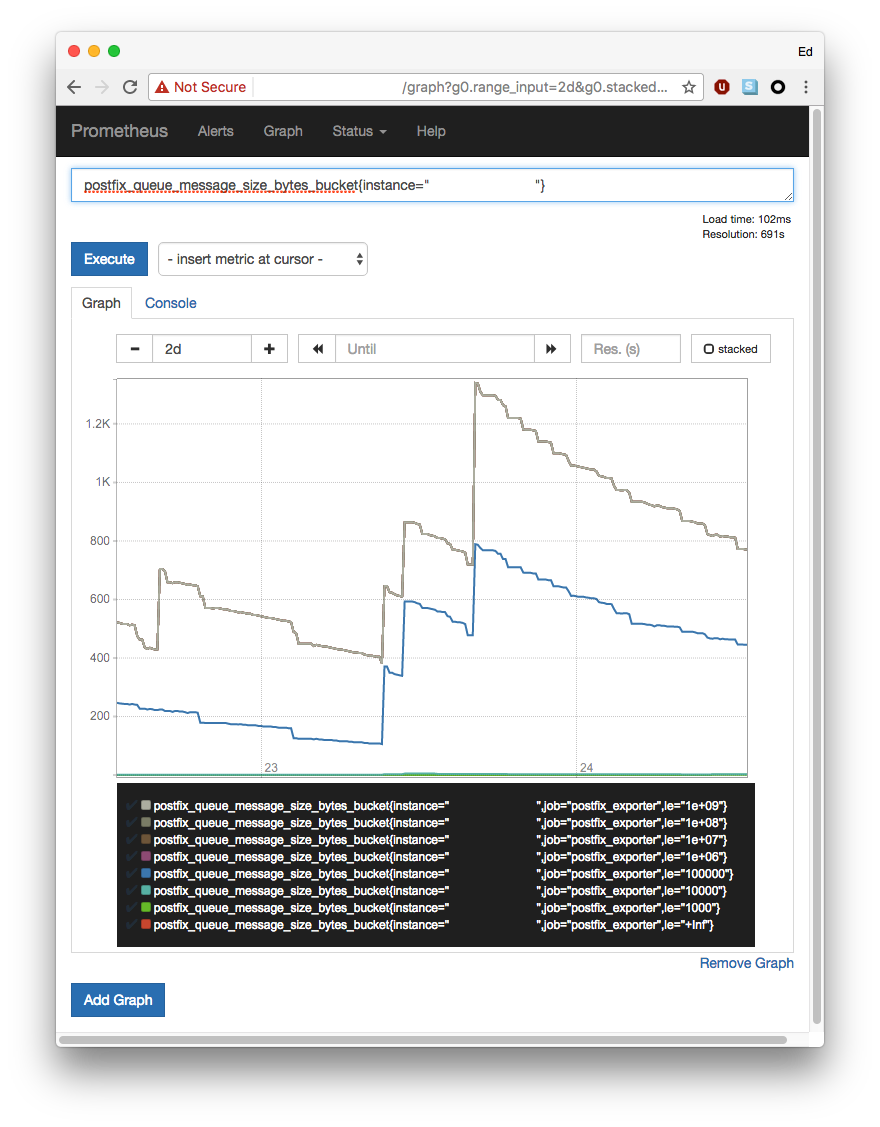 February 27th, 2017
 November 14th, 2016
 October 28th, 2016
 February 11th, 2014
 April 8th, 2013