To start this year’s series of contribution to the open source community, we’re proud to announce the release of yet another tool that we use to monitor our production setup, namely a Prometheus metrics exporter for the Dovecot POP/IMAP mail server.
One of the key features of Prometheus is that it is very well suited for white box monitoring, i.e. having graphs and alerts based on internal state of the program, as opposed to testing just the externally visible behaviour of the system. For Dovecot we’re very interested in using white box monitoring to be able to graph traffic and resource usage per customer, domain and user.
It turns out that we’re in luck, as Dovecot 2.1 and later ship with a statistics module that provides access to this kind information. When enabled, Dovecot binds to an additional UNIX or TCP socket on which metrics are exported. The Dovecot exporter that we’ve published on GitHub is basically a light-weight proxy that converts the metrics from Dovecot’s format into Prometheus metrics, exporting them over HTTP.
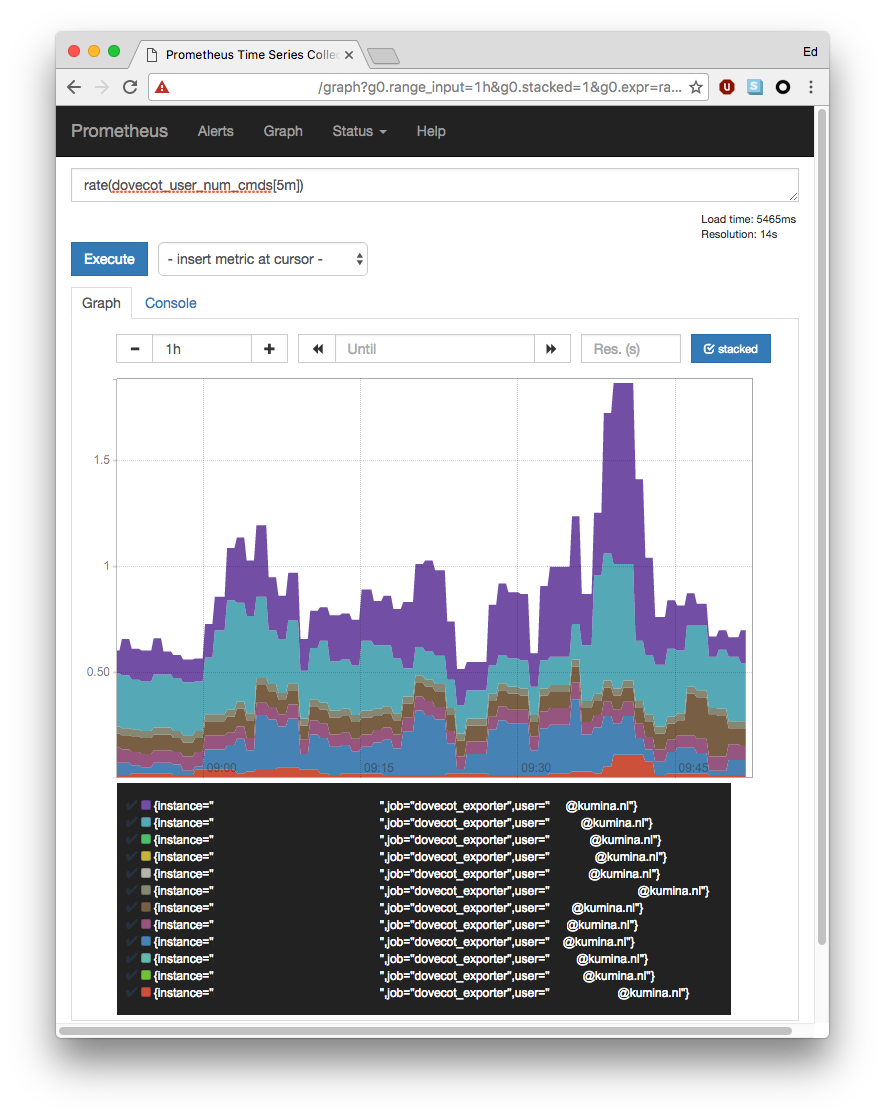
Below is a screenshot of our Dovecot exporter in action. The graph shows the rate of IMAP commands sent to our mail server, broken down by IMAP username.
If your email setup is also based on Dovecot and use Prometheus for monitoring, we’d like to invite you to give this exporter a try as well. Feel free to file issues or send pull requests on GitHub.
Tags: dovecot, github, monitoring, open source, Prometheus, software, software release, white box monitoring