Network traffic accounting with pmacct
At Kumina we’ve been a long-time user of pmacct. pmacct is an easy to use daemon for UNIX-based systems to perform network traffic accounting. Under the hood, pmacct makes use of libpcap to capture network traffic from the operating system. In our current deployment we’ve configured pmacct to write its results into a MySQL database. At the end of every month we run various queries on this database, ranging from simple summation per host to computing the 95th percentile. These results may then be used for billing purposes.
Pmacct and MySQL database
Given that the number of servers, IP addresses and the amount of traffic at Kumina has increased steadily over the last couple of years, we’re at this point running into the problem that pmacct in combination with a MySQL database simply no longer scales. Not only are our search queries taking a long time to complete, even insertions of new data are becoming problematic. A SQL database server is not the right tool for storing and processing time series.
Improving monitoring and trending
Over the last couple of months we’ve been working on replacing and improving our existing monitoring and trending setup with Prometheus. So far our experiences using it have been very positive, which is why we’ve decided that we also want to use it as the basis for a new traffic accounting setup. Being able to create recording rules that use functions like quantile_over_time() is exactly what we need, as it allows us to compute traffic percentiles not just at the end of the month, but in real-time.
Alternative for pmacct: promacct
After searching online, we haven’t been able to find a Prometheus metrics exporter that could act as a drop-in replacement for pmacct, which is why we’ve decided to develop it ourselves, called promacct. Where proamcct differs from pmacct is that instead of periodically storing results to a database, it provides access to its metrics over HTTP, allowing Prometheus to scrape it directly.
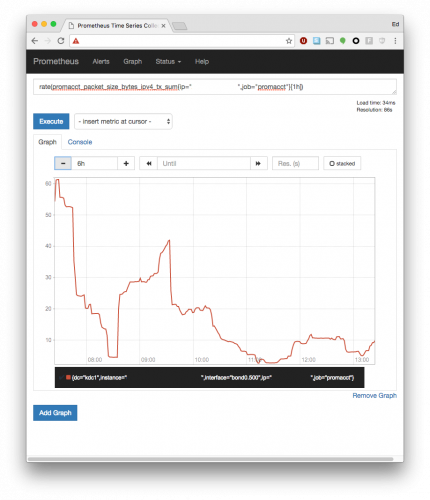
Due to promacct supporting aggregation by source/destination IP addresses, we can now easily create traffic graphs for individual hosts:
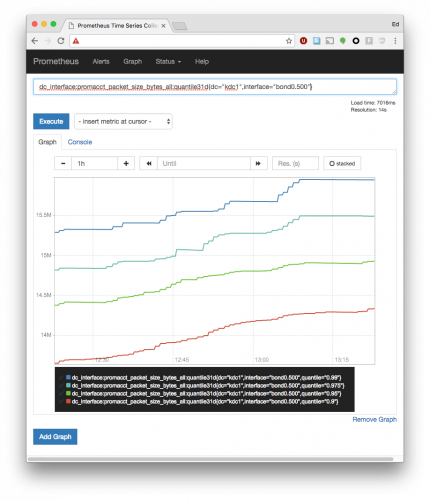
Per-datacenter traffic quantiles are computed through recording rules, so that they can be inspected at real-time:

Today we’re glad to announce that we’re releasing promacct as Open Source Software. Its source code can be found on our company’s GitHub page. Be sure to give it a try and let us know whether it works for you.
Enjoy and feel free to share!
Tags: monitoring, MySQL, pmacct, promacct, Prometheus, Prometheus monitoring, trending
