Over the last couple of months, we’ve published several blog posts to announce the release of various Open Source metrics exporters for Prometheus. The development of these exporters is an on-going process at Kumina, as we’re working towards replacing our existing Nagios-based monitoring setup with Prometheus. The old setup already has extensive coverage of all of the services we deploy for our customers. One of the services that we monitor, is Postfix. For Postfix, we’re interested in getting statistics on messages stuck in the mail queue.
Though a quick Google search reveals that there are already at least two other implementations of Postfix exporters (and many forks) available, we noticed these were suboptimal in how they work. Many versions resort to invoking shell commands periodically, which is bad from a performance standpoint. Others attempt to scan Postfix’s directory structure manually, which means that the statistics that get reported don’t necessarily reflect Postfix’s internal state.
Open source Prometheus metric exporter for Postfix
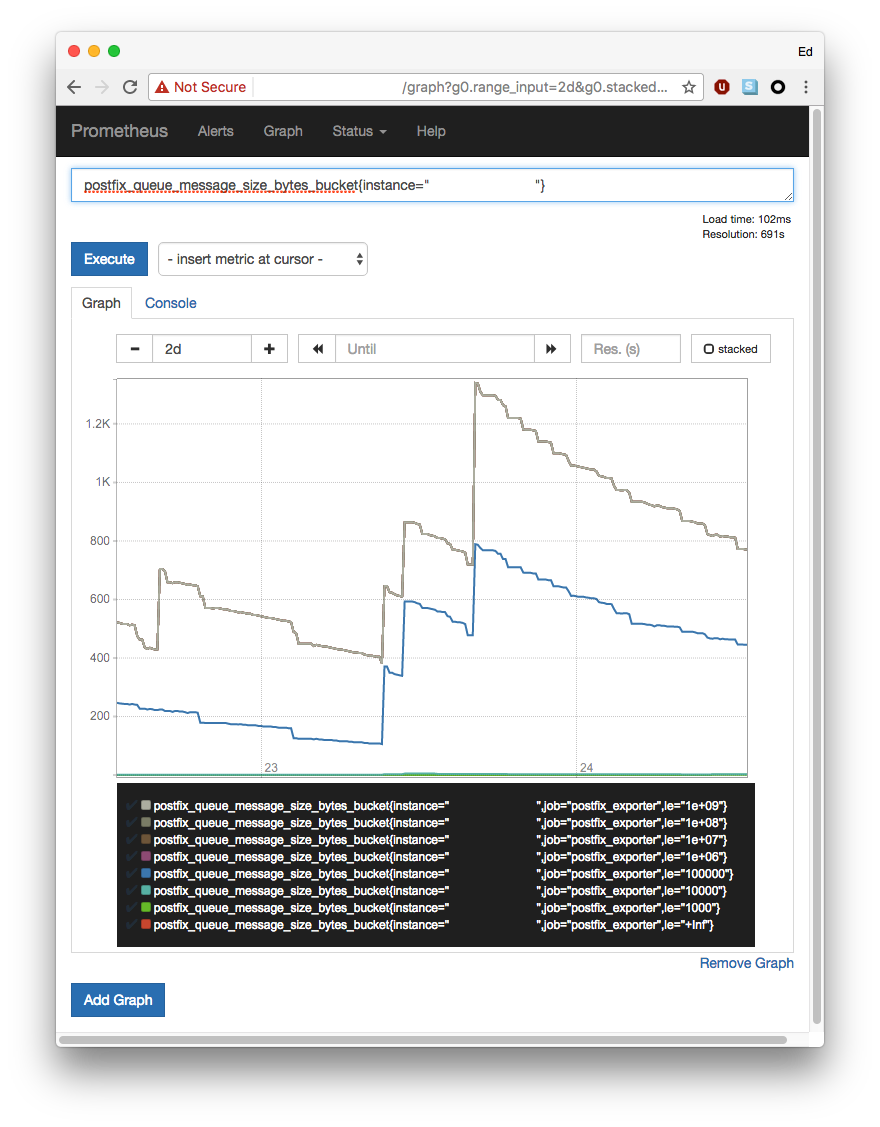
Today we’re proud to present to you our own Prometheus metrics exporter, written in Go. This version differs from the other implementations, in that it extracts it metrics by connecting to Postfix’s showq service; the same service that command-line tools like mailq and postqueue use to fetch their statistics. Our exporter publishes both message size and age in histograms, meaning that in addition to graphing the number of messages, you get good insight in their properties.
We hope that this version will form the basis of a unified attempt in providing a high-quality metrics exporter for Postfix. Feedback and contributions are well appreciated and can be submitted on the exporter’s GitHub page.
Tags: mailqueue, metrics, monitor Postfix mail queues, monitoring, open source, postfix, Prometheus, release